User journeys
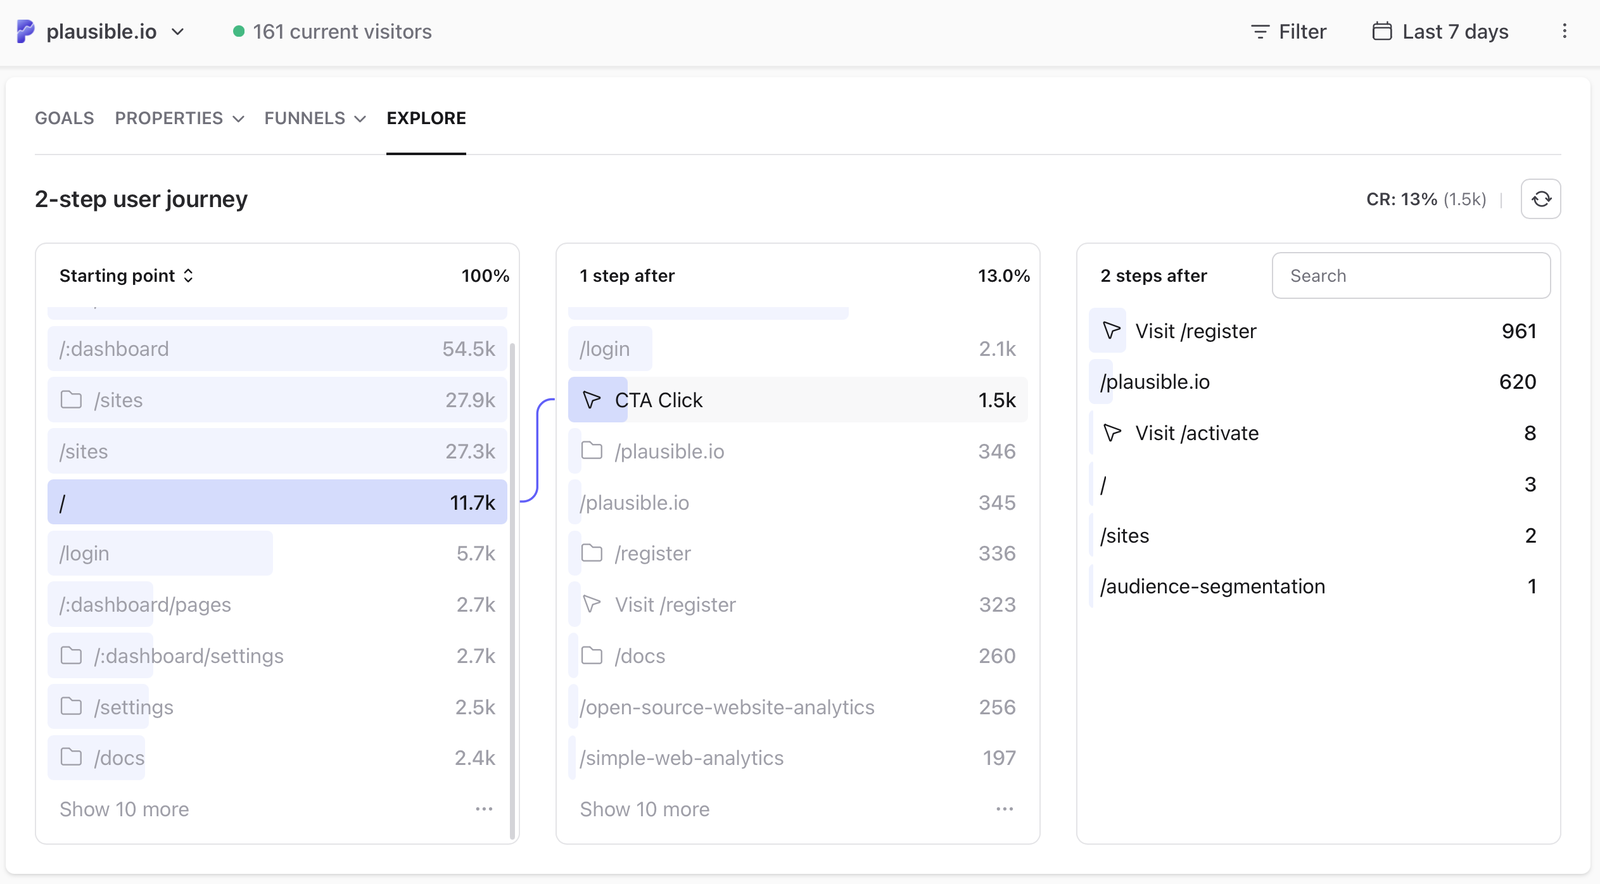
The Explore tab lets you map the paths visitors actually take on your site. Pick any page, goal or event as a starting point and see what they did next. Or work backwards from a conversion to see what led visitors there.
- Works with your pages and events. No extra setup required.
- Pages from the same directory are automatically grouped to reduce noise and surface patterns more clearly
- Individual pages within a group are also selectable if you want to drill into a specific URL
- Shows "No further action" at each step so you can see how many visitors dropped off
- Displays the conversion rate for the full journey you are exploring
- All existing dashboard filters apply, so you can narrow journeys by traffic source, country, device or any other dimension
How to use user journeys
Open the Explore tab from the report navigation bar, alongside Goals, Properties and Funnels.
You'll see a list of your most visited pages and most triggered events. Select one to begin exploring the journey. Scroll down and click on "Show 10 more" to see the expanded list, or use the search bar to search for the exact page or event and set it as the starting or end point.
Each column shows the next step in the path:
- Starting point: the page or event you choose as the entry to the journey
- 1 step after: what visitors did immediately after the starting point
- 2 steps after: what visitors did after that, narrowed to those who followed the path so far
Click any item in a column to select it and load the next step. You can go up to a maximum of 20 steps. The conversion rate in the top right updates to reflect the share of starting-point visitors who reached the selected item.
To clear your selection and start over, click the refresh icon in the top right corner.
Starting point vs end point
You can explore journeys in two directions.
Starting point: Begin from a page or event and follow what visitors did next. Use this when you want to understand where visitors go after a key page, such as your pricing page or your post-signup confirmation screen.
End point: Begin from a conversion goal and work backwards. Use this when you want to understand what path led visitors to a specific outcome, such as a trial signup or a completed purchase.
Understanding the list
By default, the list shows the 10 most visited pages and most triggered events. If the page or event you want to explore is not visible, click More to expand the list or use the search box to find it by name.
Grouped pages are shown with a folder icon. Plausible automatically groups pages that share the same directory, so /blog/post-1 and /blog/post-2 appear together as /blog. This keeps the list readable and makes patterns easier to spot. Selecting a group lets you explore journeys across all pages in that section at once. For example, selecting /docs shows what visitors did before or after visiting any documentation page, and selecting /blog shows paths around any blog post. This is much more useful than analysing one page at a time when you want to understand how a whole section of your site fits into the visitor journey. You can still select any individual page within a group if you want to drill into a specific URL.
Goals and custom events are shown with a cursor icon, so you can tell at a glance whether an item is a page or an event. Revenue goals and property-filtered goals are not included at this stage.
No further action appears at every step and shows how many visitors did not trigger any recorded page or event after that point. This is your drop-off count.
Filtering user journeys
User journeys respect all your existing dashboard filters. Apply any filter before or after you open the Explore tab and the journey data will update to reflect only that audience.
For example:
- Filter by a traffic source to see the paths visitors from a specific campaign or referrer take
- Filter by country to compare how visitor behaviour differs by region
- Filter by device to check whether mobile and desktop visitors follow the same paths
- Filter by a landing page to trace journeys that started from a specific entry point
This makes user journeys useful not just for understanding overall behaviour but for diagnosing specific segments of your audience.
Conversion rate
The conversion rate shown in the top right is the percentage of visitors at the starting point who completed the full journey you have selected. The number in parentheses is the raw visitor count.
When to use user journeys
User journeys are best for open-ended exploration. Use them when you want to understand actual visitor behaviour without defining a hypothesis upfront. Good use cases:
- See where visitors go after landing on your homepage
- Find the most common path leading to a signup
- Discover which pages visitors view before contacting support
- Check whether visitors who hit a 404 continue browsing or leave immediately
- Work backwards from a conversion to see which pages preceded it
For measuring a specific predefined path with drop-off rates at each step, funnel analysis is a better fit. Use funnels when you already know the flow you want to measure. Use user journeys when you want to discover flows you did not expect.
What's next?
- Set up pageview goals or custom event goals to use as starting or end points in your journeys
- Use funnel analysis to measure drop-off across a fixed multi-step sequence
- Use filters and segments to explore journeys for a specific audience, such as visitors from a particular country or traffic source
To learn more about website user journey analytics, head to our blog.